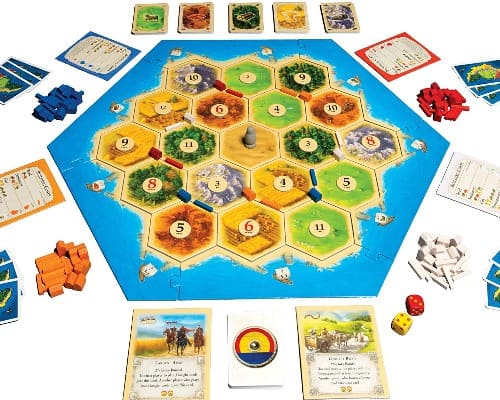
Catan is one of the most popular games ever created.
How to score
- Settlements: each is worth 1 victory point.
- Cities: each is worth 2 victory points.
- Victory point cards: some development cards are worth 1 victory point. They are kept hidden until you have sufficient points to win.
- Largest army: the player who has played the most knight cards at any time (at least 3) gets the largest army card which is worth 2 points.
- Longest road: the player with the longest continuous road at any time (at least 5 segments) gets the longest road card which is worth 2 points.
The first person to 10 points is the winner.
Let's start our analysis...
The issue: Out of 94 games, I have a win ratio of 39%.
What data is available?: BGA provides game data for yourself, all players, and the winners. I have copied out the data into a spreadsheet, cleaned it up, and started the analysis there.
Feel free to download the Excel file or CSV.
Image A below shows the average number of resources produced. There are different play styles that one can choose depending on how they first start out when placing their initial settlements.
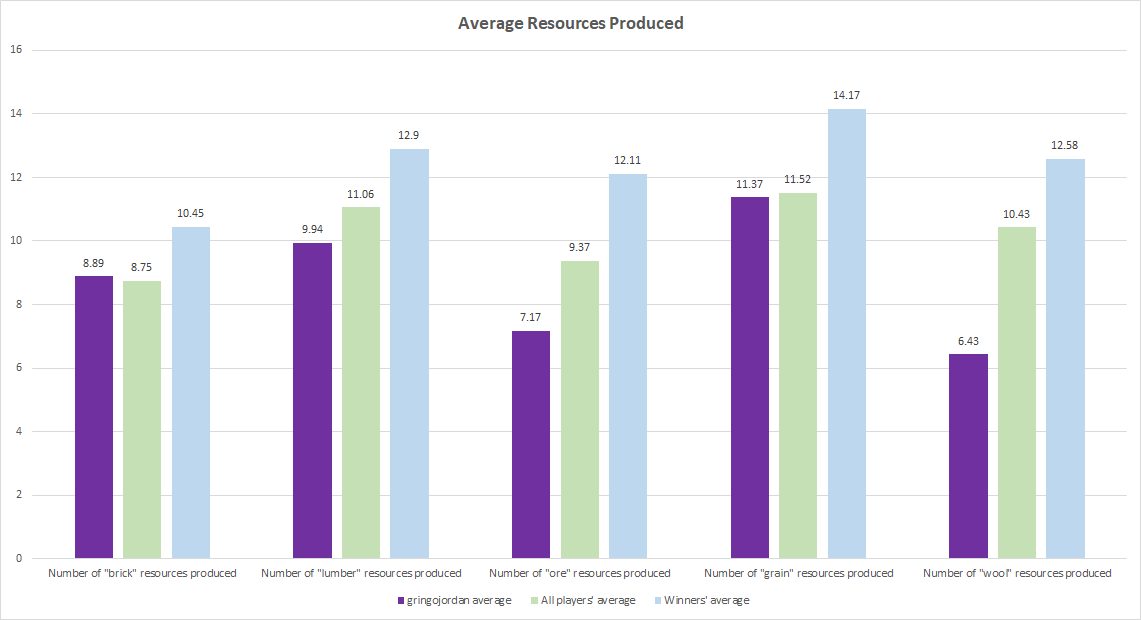
What we get from resource combos:
- Brick+ lumber = road building
- Brick + Lumber + Grain + Wool = new settlement (1 pt)
- Grain + Wool + Ore = development card
- 2 x Grain + 3 x Ore = City (2 pts)
I tend to ignore wool as I read, and maybe misunderstood, from various strategy guides that it's not as useful as going on either a brick + lumber route or that of grain + ore for city building.
It's pretty evident in the data here given that there's a +6.15 gap between my average wool produced and that of the winners. Is that hurting me?
What also stands out to me is that even if I did focus on other resources the winners are FAR more productive. +4.94 more ore than me, +2.8 more grain, and +2.96 lumber on average.To address this issue, I may need to think about how to make sure all my tiles are being as efficient as possible in producing resources. I have read that it's bad practice to put initial settlements on coastlines, where you're only producing from two tiles, instead of three, and yet it's something I'll do when the occasion presents itself, especially if it's a useful trade port. This has helped me in the past but maybe that's a bias that I'm ignoring - when it works, great, but maybe, via the data, we see that that strategy isn't working so well.
Assessing Victory Point Production
In Image B, we can see a comparison of the average victory points (VP) between myself, all players, and the winners.
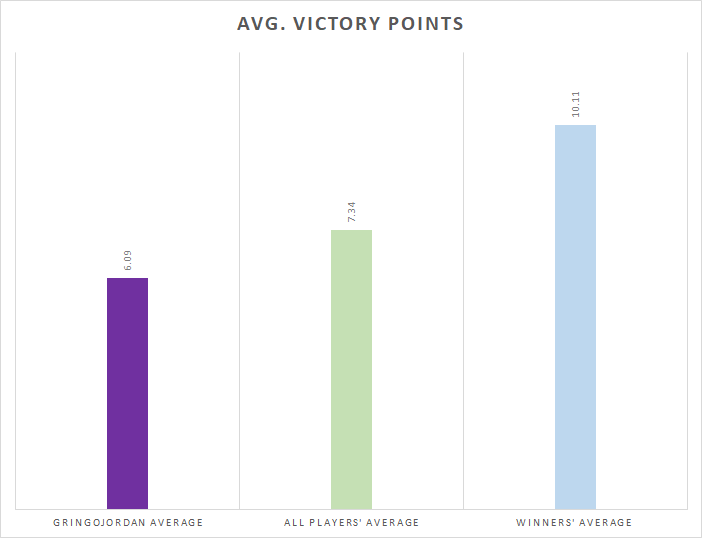
Oof.
Compared to all players, I average -1.25 points less. Compared to winners, it's -4.02 less.
Image C displays the average number of victory points per scoring type or unit.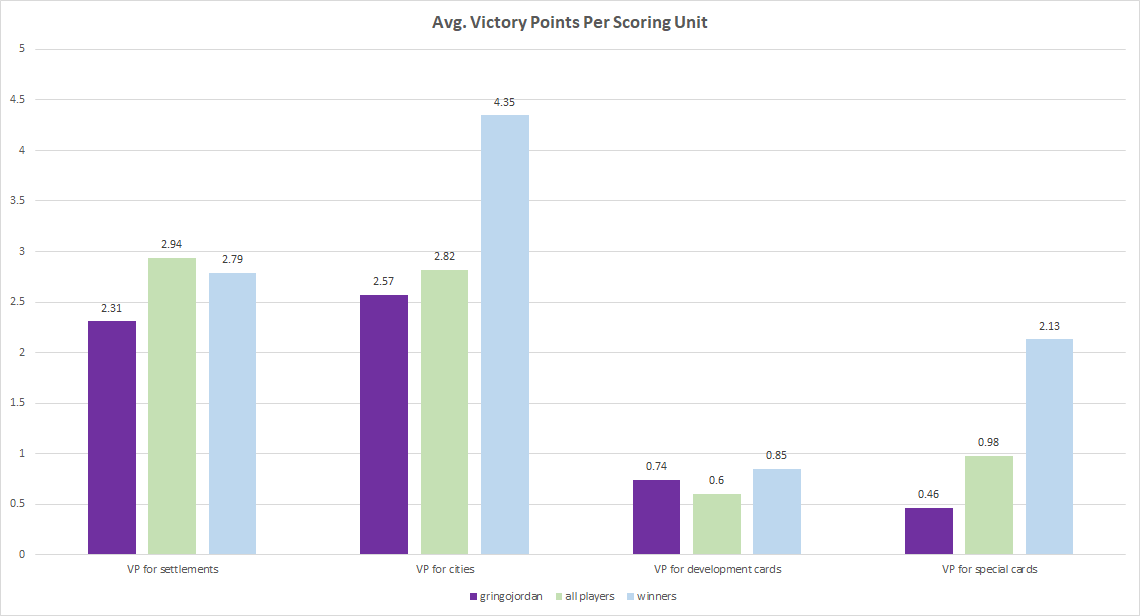
Where am I having issues?
In terms of points for settlements, it's not so bad. -0.48 off the winners, and even their average is below that of all players.
Where it's truly visible is in my city building. My average: 2.57 victory for cities; Winners: 4.35 VP. I'm a slim difference from all players on this but quite far off the winners.
If we look at the components that build cities again, we can see that my ore production is terrible and grain isn't great. Maybe by fixing that and focusing on upgrading settlements to cities faster / more often, I can start gaining more VP?
Another factor that stands out in terms of average victory points are the points for special cards. These are cards that you get for having the Longest Road and/or Most Knights, which are worth 3 points each. I only average 0.46 VP for these where winners average 2.13.
This leads us back to that dearth of wool resources as well as the underproduction of grain and ore. We can also see that winners typically buy an average of 3.81 development cards vs my 3. They also use them at a higher rate.
In terms of bad things happening to me and my resources, I seem to be doing ok. We can see that in Image C.
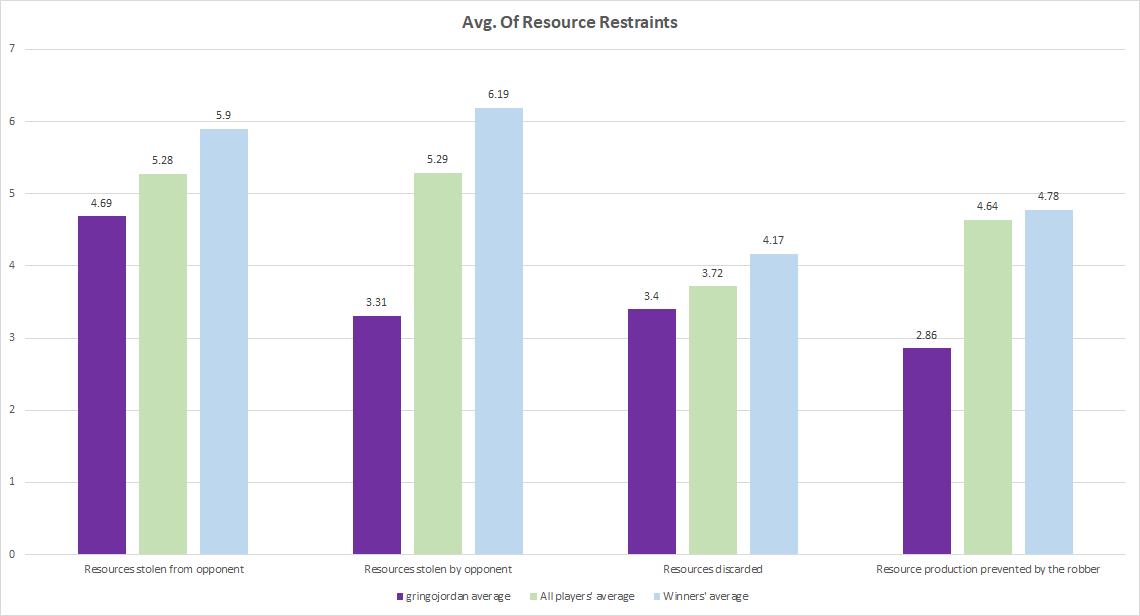
Opponents are not stealing as many of my resources as they are all players or the winners nor are they using the Robber to prevent production as often. For both averages, I'm nearly half of those of the winners.
The assumption here is that I'm doing something right. But, it could be that a) I'm not creating resources that people want to steal and b) I'm not typically in a position where people want to use the Robber to prevent me from gaining more of a resource. I don't have data to back this up but, through these many games, my observation is that if you're in the lead, you're going to be the main target for theft.
If I'm not in the lead, and not in advantageous resource regions, I'll be ignored. This is good for flying under the radar but obviously bad for actually getting towards victory at the end of the game.
What conclusions can we draw?
- A focus on increasing my resource production especially in the areas of wool and ore will be very beneficial
- Using that focus to upgraded to cities more often should help
- Ignoring port / coast benefits and making sure my initial settlement placement lands me on three tiles is important
- Utilizing more development cards or aiming for one of the special victory cards might be beneficial
Thanks for reading!