Top Five EPL Transfers (2010-2020)
Summary
This analysis follows on from my first one, in which I examined the top transfer of each year of the English Premier League. In that, I only tracked transfers into the League. Of course, the EPL may be one of the richest, most competitive leagues, but there are major teams with strong financial backing throughout Europe that will effect overall transfer prices. One goal of both analyses is to see if there are any trends.
Process
The process for this was similar to the previous one. I took data from Transfermarkt, adjusted the fess for inflation in British pounds, and plotted it in Tableau. This time, we are looking at the top five transfers for a season both into and out of the Premier League. Due to having to due most of the data collection by hand, I limited the time period to a ten year period, 2010-2020.
Analysis
The chart below shows our results. I chose to also color the data points by the team that was joined. We can see a general steady upward trend with quite a few outliers. Throughout this period, there is quite a lot of representation from Manchester City, starting in 2010, when it took all five spots at the top.
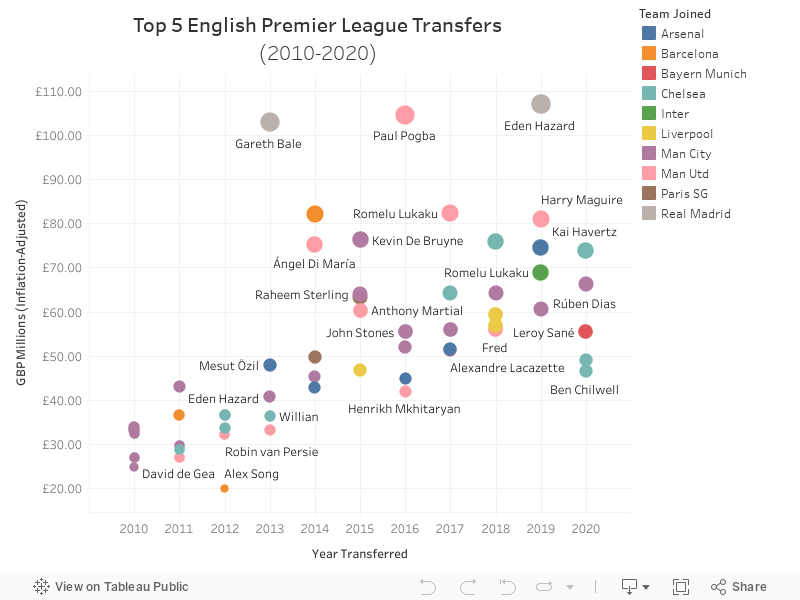
The main outliers are the transfers of Gareth Bale, from Tottenham to Real Madrid, Paul Pogba, from Juventus to Manchester United, and Eden Hazard to Real Madrid.
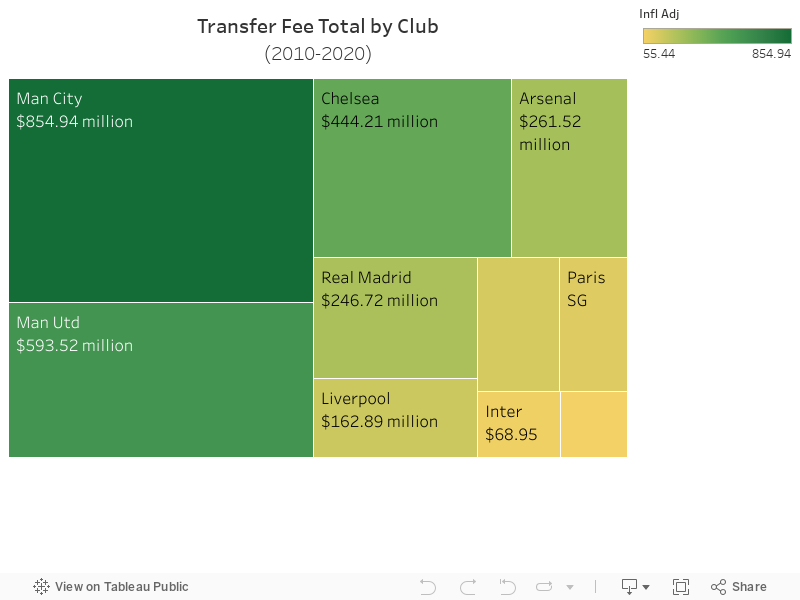
We can next look at the total spend by club, as seen in the chart below. Manchester City clearly comes out on top, with Manchester United, and Chelsea close behind.
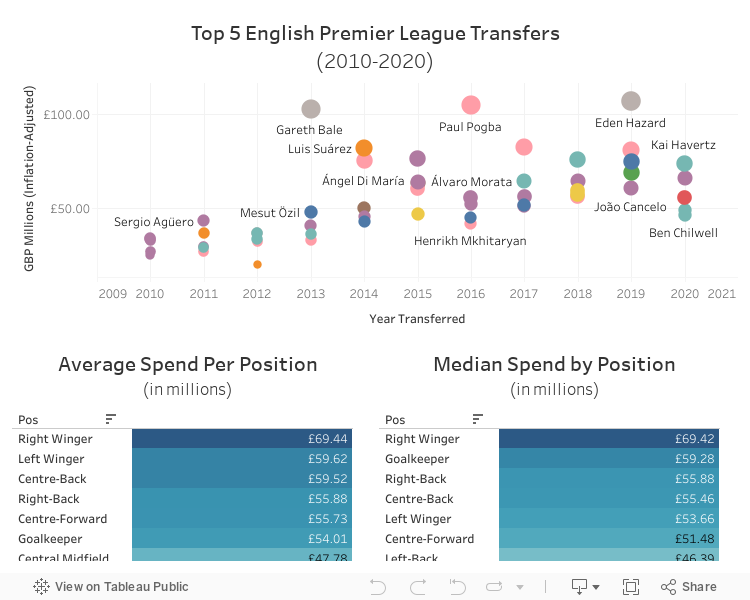
I was also curious how spending broke down by position. Below, you'll see the average and median spend per position. It would be more helpful if I had more data points overall throughout these years on all transfers and could see how it compared. The $80 million spent on Harry Maguire, a central defender, was extremely criticized at the time.
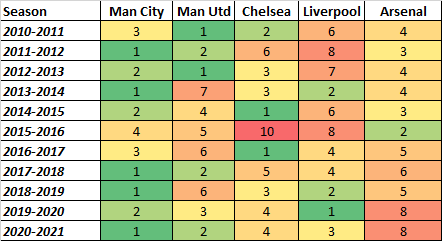
We have to ask: how is this relevant to clubs? Does spending more on transfers lead to better finishes to a season? If we look at the table below, we can see that the two top spenders have finished much higher than the others within the EPL.
End of Season League Position
There are more factors at play as well, especially given the manager changes that have occurred throughout these clubs in the decade looked at, as shown below. Only the EPL clubs mentioned in our dataset are shown.
| Season | Team(s) |
|---|---|
| 2010-2011 | Liverpool, Chelsea |
| 2011-2012 | Liverpool (x2), Chelsea |
| 2012-2013 | Chelsea (x2), Man City, Man Utd |
| 2013-2014 | Man Utd |
| 2014-2015 | Liverpool |
| 2015-2016 | Chelsea, Man Utd, Man City |
| 2016-2017 | None |
| 2017-2018 | Chelsea, Arsenal, Man Utd |
| 2018-2019 | Chelsea |
| 2019-2020 | Arsenal |
| 2020-2021 | Chelsea, Man Utd |
It's beyond the scope of this project to determine what effect managerial changes can have on a club. A steady hand at the wheel, given the opportunity to buy the players to fit their system, can do well. Some clubs are used to the tumult and can still succeed given a core group of players.
One thing that Stefan Syzmanski has pointed out in his "Soccernomics", which gives even more in-depth than either of my projects, is that wages can determine winners. Teams with more money will attract the best players because they can pay the most wages. I don't have the data he does to go through that but it does seem that that would be one of the many defining factors behind a club's sucess.
Thanks for reading!