Highest Transfer Fees in the English Premier League
Summary
Below we see if there are any trends in transfer fees in the English Premier League, from it's founding in 1992 to 2021. I used data from Transfermarkt to get the estimated fee then adjusted it for inflation.
A transfer fee is a fee that is paid from one team to another to transfer a player to their club. This may be unfamiliar within the US but is one of the most common ways for players to move between soccer clubs outside the US.
Example: Club A is interested in signing Bob Bobson from Club B. Club A offers Club B $10 million to sign the player. Club B agrees and Club A is now allowed to offer a contract to Bob Bobson. Once Bob and Club B agree on terms, and they sign on, Club A receives that $10 million fee.
Result
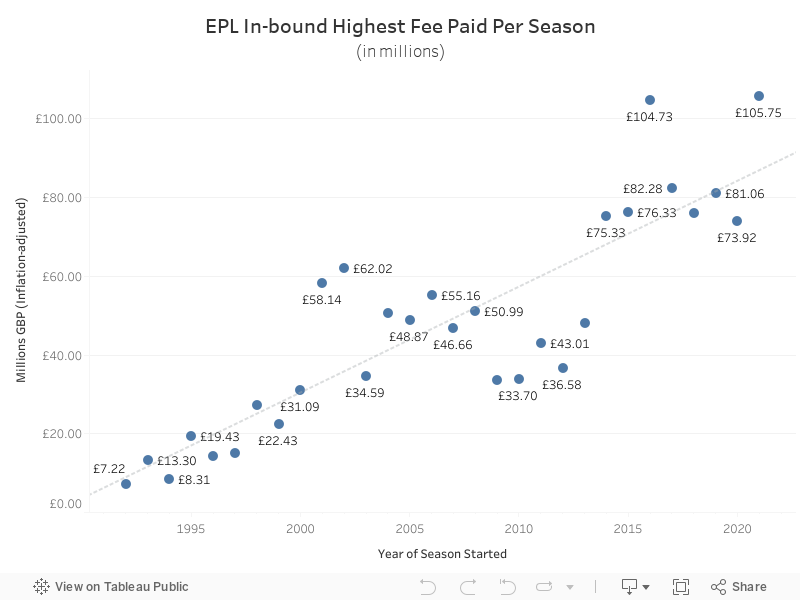
Here is the chart created in Tableau. Hover over the data points to view player name.
Background
Year after year, the English Premier League, the richest soccer (football) league in the world seems to make the news with insanely high transfer fees reported for its players. I was curious to see how these fees have changed over time as more money has flowed into the sport. The first season of the English Premier League began in 1992. The highest feed paid for a player that season was for Alan Shearer - £4.05 million (or $11.45 million USD). The highest fee paid for a player in 2021 was for Jack Grealish - £105.75 million (~ $130 million USD). One could say things have changed quite a bit!
Process
The source I used for the data is a website called Transfermarkt, which produces data on players across many soccer leagues. The data is sourced both in-house and via outside contributors. There isn't an API which I could pull the data and I'm still learning how to scrape data with python (watch this space) so I manually copied it out and added it into a spreadsheet (download xlsx or csv here).
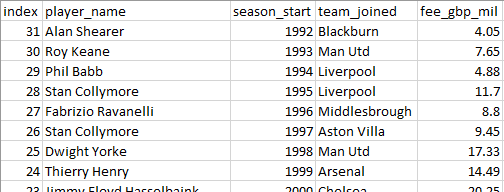
I took the player name, the season the player was transferred (using the year of the beginning of the season), what team they joined, and the fee paid in British pounds so there was consistency across the data.
Next, I wanted to adjust all the fees for inflation. This required learning about inflation in the UK for this time period. What an exciting way to spend an afternoon!
I found a handy calculator from the Bank of England but it couldn't handle decimals. The BoE website had a great explainer area plus links to where they pulled their data from and how it was used to create the calculator. I was led to the (Office of National Statistics) and downloaded data from there for the yearly CPI from 1988-2021.
From here, it was straightforward to calculate the inflation. For example, to adjust the fee paid for Shearer in 1992, the calculation was initial_fee * (CPI_in_1992/initial_fee) = inflation adjusted fee. In this case: 4.05*(62.6/4.05) = 7.22. Even though it couldn't handle the decimals, I used the Bank of England calculator to see if I was within range of its own calculations.
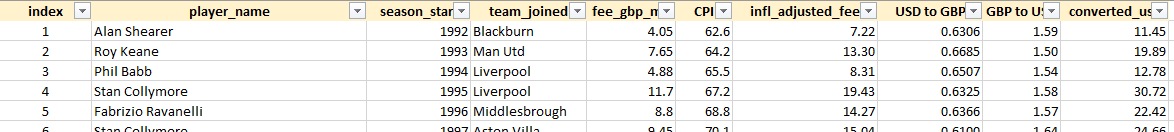
Though not in the Tableau chart, I also translated inflation-adjusted fees into US dollars, especially as there have been large fluctuations between the currencies over these thirty years. When I worked in London from 2005-2006, it was almost 2:1. Now, the British pound has lost a lot of purchasing power. I research and added data for converting GBP to USD then multiplied that against the inflation adjusted fees to get what the dollar value would be.
Analysis
So what can we learn from looking at this data? What trends can we see?
The first thing I notice is that there is a steady, but not substantial increase until 2001. In 2001 and 2002, there were two outliers that broke the trend and at least doubled the price of the previous transfers - Juan Sebastian Veron at £58.14 million in 2001 and Rio Ferdinand in 2002 for 62.02 million. The previous transfer record was £31.09 million for Jimmy Floyd Hasselbaink.
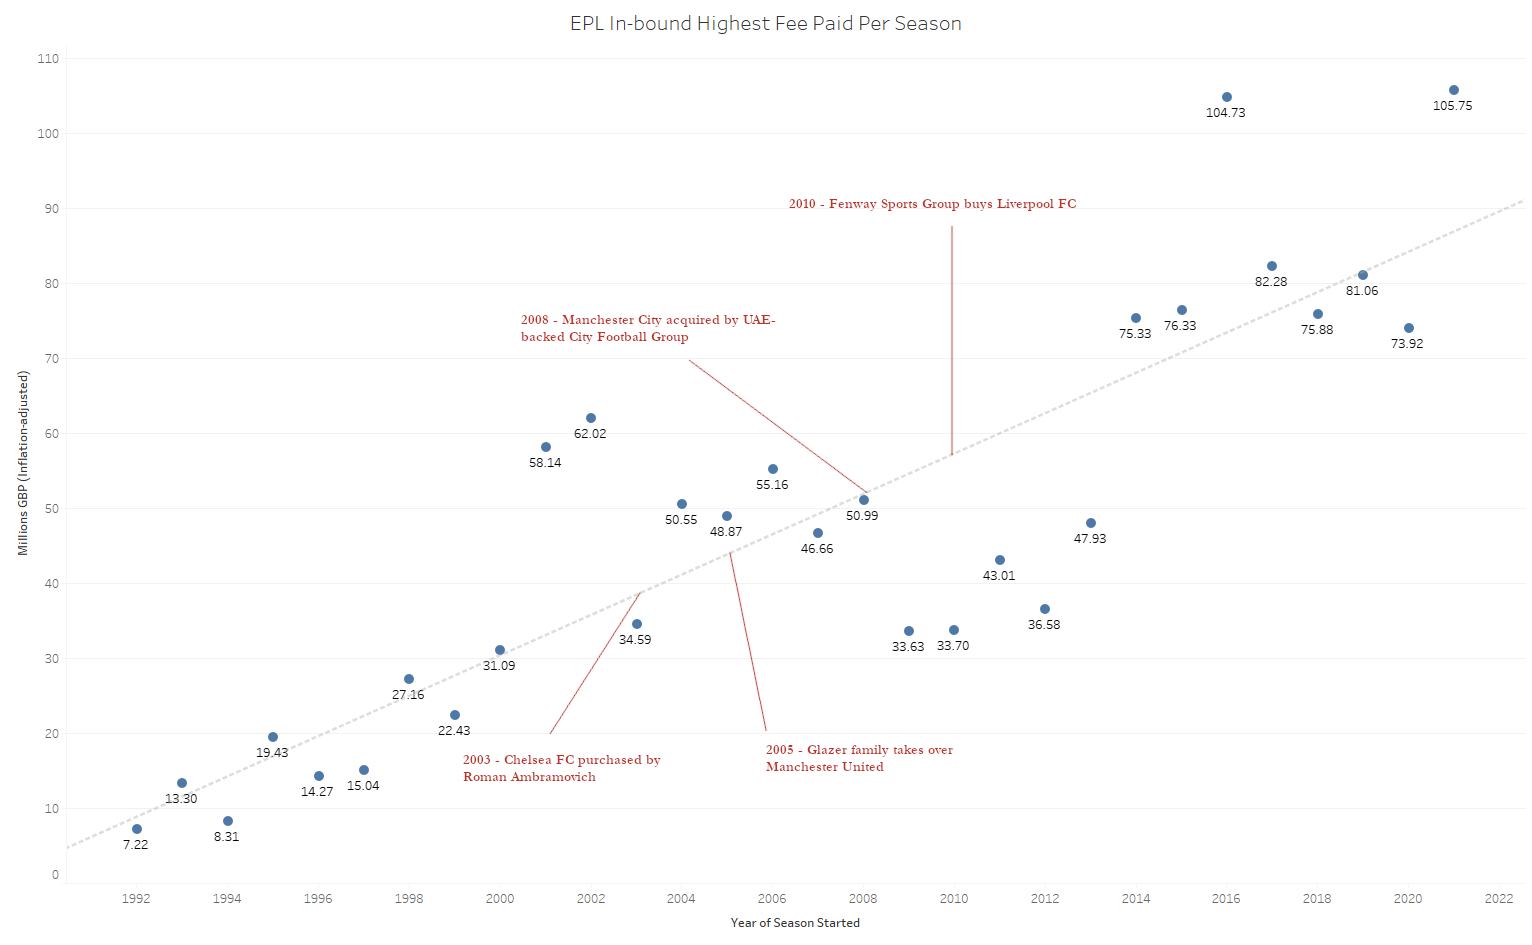
From there, fees hovered around the trend line of £50-60 million until 2009, when they dipped significantly. My assumption would be to attribute this to clubs having to cut back on spending due to the 2008 financial crisis, which became especially severe in the UK due to the austerity measures they implemented throughout this period. Fees were around £33 million, finally rising to nearly 48 million in 2013 (Mesut Ozil to Arsenal).
One thing EPL supporters have heard since 2003 is that the acquisition of Chelsea by Roman Abramovich changed the game in terms of people with limitless means are able to purchase title-winning teams. It's an assumption that bears further examination. For the time being, I have noted major ownership changes of high-spending clubs in the image below.
Then, we have a great leap...
Whereas Ozil went to Arsenal from Real Madrid for £47.93 million in 2013, the next year saw Angel di Maria leave Real Madrid for Manchester United for £75.33 million, over 1.5 times as much. A possible factor in this, and something I might explore in another data visualization, is that he was heavily involved in Argentina's second-place finish at that summer's World Cup.
The fees for players in the EPL do not go down from here but stay at the highs that are now common. From the chart, we can see some steadiness around the £70-85 million line with some outliers like the transfers of Paul Pogba (£104.73 million) and Jack Grealish (£105.75 million).
Where To Go From Here?
I knew that for this, my first personal data project, I wanted to do something straightforward and relatively simple. First, this league doesn't exist in isolation of other leagues and the wealthy clubs within them. It's something I am planning on looking at in another analysis.
There are many other interesting questions I'd like to answer around transfer fees within the league and other leagues:
- Whether the "English premium" is a myth. This is the chat about how English players are always worth a premium, either due to home-grown status (which is an allotment teams have to fill) or otherwise.
- Does performance in a major tournament typically lead to a transfer or higher fees?
- What percent did the top transfer for each year take up as part of a club's overall transfer spend?
Thanks for reading!